 |
|||||||||||||||||||||||||||||||||||||||||||||||||||||||||||||||||||||||||||||||||||||||||||||||||||||||||||||||||||||||||||||||||||||||||||||||||||||||||||||||||||||||||||||||||||||||||||||||||||||||||||||||||||||||||||||||||||||||||||||||||||||||||||||||||||||||||||||||||||||||||||||||||||||||||||||||||||||||||||||||||||||||||||||||||||||||||||||||||||||||||||||||||||||||||||||||||||||||||||
|
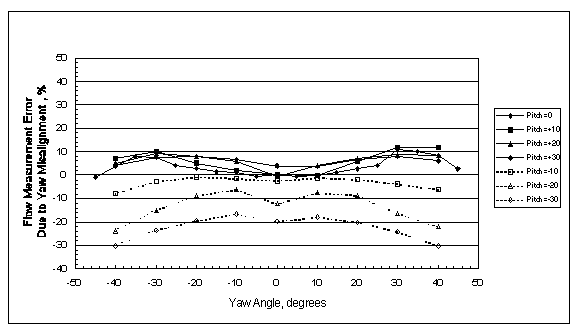
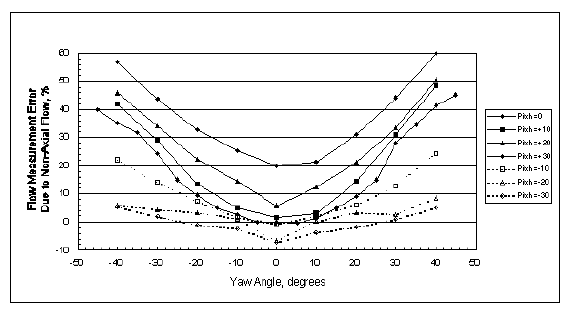
Authors: Stephen K. Norfleet RMB Consulting & Research, Inc., 5104 Bur Oak Circle, Raleigh, North Carolina 27612 Larry J. Muzio and Tom D. Martz Fossil Energy Research Corporation, 23342 C South Pointe. Laguna Hills, California 92653 ABSTRACT Since the installation of continuous emissions monitoring systems (CEMS) under the Acid Rain Rule (40 CFR Part 75), many utilities have found that CEMS are recording consistently higher heat input and SO2 emissions than conventional methods (input/output and output/loss). This discrepancy, which appears prevalent across the industry, is causing utilities to report greater heat input and SO2 and CO2 emissions than are believed to be justified. This paper describes "swirl tunnel" tests recently completed as part of an Electric Power Research Institute (EPRI) research project initiated to identify the cause(s) for high CEMS measurements. The testing was performed in a precision flow facility with custom fabricated swirl vanes for inducing different tangential flow components, variable speed fan control for flow rate adjustment and a venturi section for total flow measurement. Results are presented from tests designed to systematically assess the effect of non-axial flow components on EPA Methods 1 and 2, the relative suitability of alternative multidimensional pitot probes and the relative accuracy of pressure reading instrumentation. INTRODUCTION Since installing CEMS as required under 40 CFR Part 75, many utilities have found that CEMS are recording consistently higher heat input and SO2 emissions (and CO2 emissions) than conventional methods, such as input/output and output/loss methods. This discrepancy, which appears prevalent across the industry, is causing utilities to report greater heat input and SO2 emissions, by as much as 25 percent, than are believed to be justified. The impact of this problem is far reaching. With many units restricted by SO2 mass emission and heat input limits under existing operating permits and the increasing tendency of states to use Part 75 data for enforcement, the measurement errors could trigger tremendous derating. Bias in the CEMS measurements translates directly into over reporting of SO2 allowances under the Acid Rain Program, already real money for Phase I utilities, with millions of dollars of impact. CEMS bias also introduces serious technical (and possibly legal) concerns into the Title V process. While the problem is real and apparently pervasive, the solution has been elusive. There has been no consistent, obvious cause. Yet, although flow measurement does not seem to be the sole culprit in all cases, since flue gas flow rate is common to both heat input and SO2 emission calculations, it is highly suspect. One potential source of bias may be Method 2, EPA's standard measurement method for stack volumetric flow rate. Since Method 2 is used not only to certify, but also to calibrate CEMS flow monitors, any bias in Method 2 may be transferred to the stack flow monitors. In order to better understand the problem, EPRI has initiated a project to identify the cause(s) for the high heat input and SO2/CO2 emission measurements. The project has three basic objectives: (1) to understand the potential error in Method 2 under stack flow conditions by a review of existing literature and data, (2) to demonstrate the validity of the literature assessments by conducting flow measurements in a specially designed "swirl tunnel," and (3) to verify the flow and heat input errors and identify the cause(s) in full scale field tests. This paper concentrates on the results of the recently completed "swirl tunnel" tests. One of the reasons for fabricating a tunnel where controlled swirl could be induced was to demonstrate whether error estimations based on straight-flow wind tunnels testing were indeed comparable to the measurement errors associated with true cyclonic flow. A number of studies suggest that S-type pitot errors due to non-axial flow can be significant, even with an average resultant angle of less than 20 degrees as allowed by Method 1. (Muzio, L.J, et al.; Flue Gas Flow Rate Measurement Errors, Interim Report TR-106698 2819-32; Electric Power Research Institute, June 1996.) This error relates to a design characteristic of the S-Type probe, its moderate insensitivity to misalignment. This characteristic, while minimizing bias associated with probe misalignment in the tangential (yaw) or radial (pitch) flow directions (see Figure 1), contributes to bias when measuring flow with non-axial components; the velocity head includes non-axial components when only the axial component is desired. Figure 2 shows error estimations for flows with both tangential and radial components as simulated in a wind tunnel with combined yaw and pitch misalignments.
The "swirl tunnel," likewise, also allowed for more complete testing of the relative suitability of alternative two- and three-dimensional probe designs pitot probes. If cyclonic flow is indeed a contributor to the high bias with Method 2, one approach for more accurate flow measurement is the use of directionally sensitive probes rather than the S-type probe. If the pitch component does not play a significant role, then, perhaps, a two-dimensional probe or a "yaw nulling" technique might suffice. As for 3-D probes, the probe should ideally exhibit a high degree of angular sensitivity with well-behaved responses to pitch and yaw while the velocity measurement should be insensitive to yaw and pitch. "Swirl Tunnel" Design Figure 3 shows a layout of the "swirl tunnel" along with its sampling ports. The tunnel was constructed and located at Fossil Energy Research Corporation's (FERCo) facility in Laguna Hills, California. Due to space constraints, a "two-level" construction, as shown in the figure, was used. The upper section contained the swirl generating vanes and the test stations while the lower section consisted of the venturi and the fan. Air entered the tunnel via a bell inlet after which it passed through either a six-inch deep honeycomb flow straightener (L/d=12, L/D=0.17 and d/D=0.014) or one of a set of removable fixed vane sections used to generate the non-axial swirl flow components. Leaving the swirl vanes, the flow entered the test section, housing two test stations with four ports each and Plexiglas windows for visualization. Upon leaving the test section, the flow passed through a 180 bend incorporating turning vanes to reduce the pressure drop and help straighten the flow, i.e., keep the flow from "hugging" the bottom of the duct as it exits the turn. Leaving the turn, the flow passed through another honeycomb flow straightener, the venturi section and then through the fan. The venturi, which conformed to ASME specifications, had an inlet diameter of 35.96 inches and a throat diameter of 23.45 inches. The fan was followed by a three-foot diffuser. A 50 hp variable speed axial vane fan capable of maintaining five inches H2O of pressure powered the tunnel. The unit was operated in an induced draft mode to minimize fan effects on the flow. The tunnel duct had a three-foot diameter with a flow of 38,000 scfm at a velocity of 90 ft/sec. Since only four swirl conditions were included in the test plan (no swirl and three different levels of swirl), removable fixed swirl vanes were opted over variable swirl vanes to belay concerns over repeatability with manually adjusted variable vanes. The vanes, fastened together by a hub, were constructed with a constant angle over the radius with 50% overlap so that no straight flow would pass; i.e., longer vanes were used to generate smaller yaw angles. The vanes were designed to generated yaw angles of approximately 10, 20 and 30 degrees. The vanes produced very constant swirl angles across the duct with very little pitch. The hub had little effect on the flow beyond the very center of the tunnel. Venturi Performance Confirmation Test Venturi performance is well understood and has been established for various geometries. Since the venturi was fabricated in accordance with ASME specifications, the calculated flow rate is expected to be highly accurate. Nonetheless, a comparison of venturi calculated velocities and flow rates from standard-type pitot tubes was performed. Table 1 shows the results of this comparison. As can be seen, the flow rates based on the standard pitot were about 2.07% higher than the venturi values.
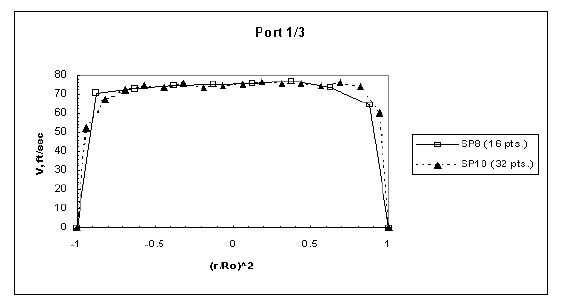
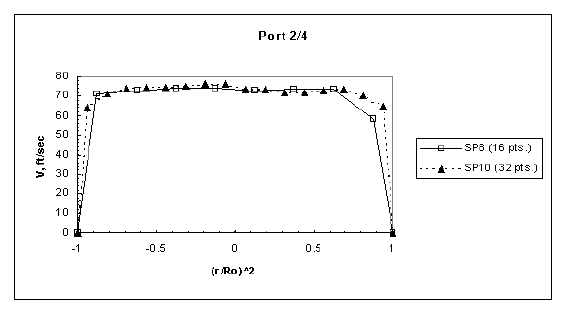
However, there is the issue, especially in a small tunnel, of how well equal area pitot traverses account for wall effects. Equal area pitot traverses, as prescribed by Method 1, do not account for the velocity going to zero at the wall. The results of traverses SP8 and SP10 are shown in Figures 4a and 4b, where the x-axis is in terms representative of fractional area, i.e., (r/R0)2. To account for the wall effect, the traverse data for Test SP10 (32-point traverse) were numerically integrated and compared to the standard pitot and venturi results as shown in Table 2. The integrated value was about 2.6% lower than the standard pitot traverse that ignored wall effects. Conversely, the venturi was in very near agreement with the integrated value that took into account the wall effect.
Since the tunnel test plan focused on a comparison of various probes and their relative measurement of velocity, the venturi discharge coefficient was modified to match the standard pitot equal area measurements. In other words, since the pitot tubes ignore the wall effects, the swirl tunnel test plan ignored the wall effects. During the "confirmation testing" period, velocity profiles were also taken at the inlet of the venturi to demonstrate the effectiveness of the turning vanes in the bend and the flow straightener for preparing the flow prior to the venturi. While there was some increase in variation of the flow at the venturi inlet with the swirl vanes present, it was not anticipated that the vanes would have significant impact on the venturi readings, especially given the small impact of swirl on a venturi (Miller, R. W.; Flow Measurement Engineering Handbook, 2nd ed.; McGraw-Hill, Inc., 1989; pp 5-36, 5-37.). In conjunction with the confirmation testing, comparison was made of data taken both manually using inclined manometers and automatically with electronic pressure transducers/data logger. As Table 3 shows, there is no significant difference between the velocities measured using the inclined manometers and the electronic pressure transducers. This would be expected given the extremely stable, controlled stable flow environment of the tunnel, but may not be the case in utility stacks where such stable conditions would be highly unusual. [Preliminary EPRI field test results suggest a potential bias in manual pressure readings, which appears to be related to a tendency of individuals to overestimate when doing "eyeball averaging" of fluctuating readings. This overestimation appears to be about 1 to 2%.]
Probe Comparison Testing Table 4 shows the results of comparison testing for following five probes, three supplied by EPRI and two provided by EPA (other probes were also tested but are not included with this paper):
All EPRI supplied probes were new probes. The S-Type and the DAT probes are standard, commercially available probes that were manufactured by United Sensors. The spherical 3-D probe was custom built for this project. Prior to the testing, all of the EPRI supplied probes were calibrated in the University of Alabama (Birmingham) wind tunnel.
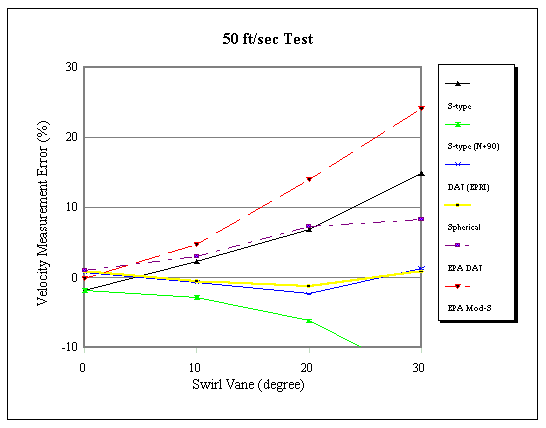
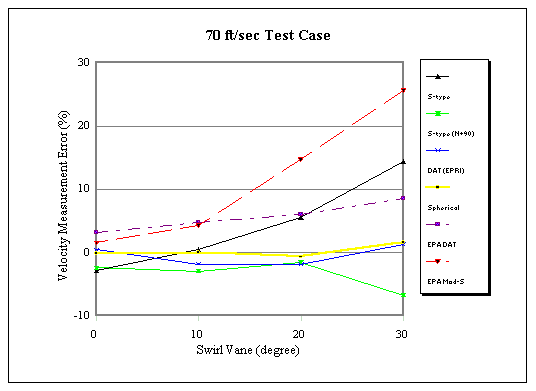
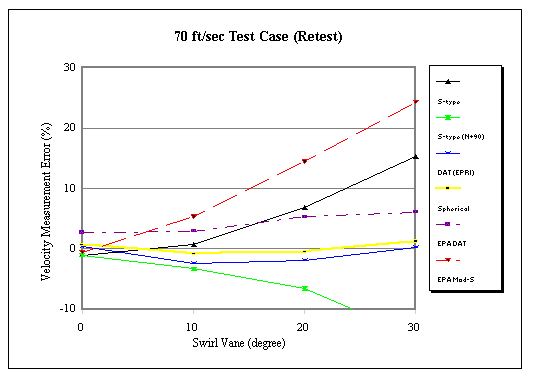
All traverses were performed in "Sample Plane B" as shown in Figure 3. While four "half-traverses" (i.e., measurements at four points for each port test) were performed EPRI probes, full-length traverses were performed from the bottom test ports for the EPA probes. The full traverses were necessitated due to the longer length of the EPA probes coupled with the confines of the building. Four series of tests were performed. Tests were conducted at three different velocities of approximately 50, 70 and 90 ft/s. The fourth test series was a duplicate of the 70 ft/s series to demonstrate repeatability. For each test, the variable speed fan was adjusted until the approximate desired velocity was indicated by the venturi. This approximate velocity was maintained while traverses for each of the various probes were tested in conjunction with various swirl conditions. It was seen that the swirl vanes designed to generate approximately 10, 20 and 30 degrees of yaw actually yielded about 13, 24 and 35 degrees of yaw, respectively. This difference in the anticipated swirl and actual performance swirl of the vanes had no bearing on the results of the testing since the goal of the test was to see how well various probes performed under similar, not specific, non-axial conditions. While slightly different from the anticipated values, the actual swirl generated for a particular vane was seen to be constant across the test section. Figures 5-8 graphically displays the measurement error associated with the various probes, where error is defined in terms of percent difference with the venturi-based flow value. Only minor differences are seen when comparing the four figures, indicating little effect of Reynolds number change over the range of velocities tested.
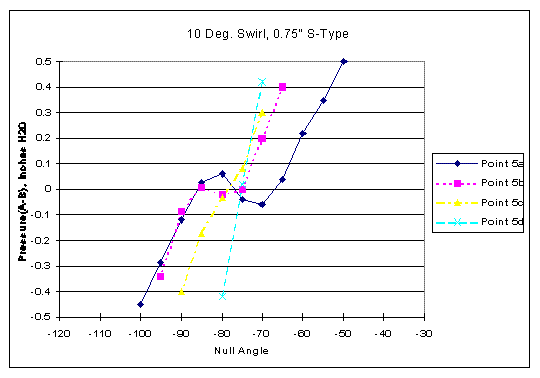
The results of the DAT (EPRI) and the Spherical 3-D probes were very similar and demonstrated good repeatability. As anticipated, the error band associated with the Spherical probe were somewhat tighter than that associated with the DAT probe. The response of the EPA DAT probe did not match that of the EPRI DAT probe and performed much more poorly than expected. [An incorrect calibration was suspected, but has not yet been confirmed. The EPA probes, as well as some of the EPRI probes, have undergone secondary, post-test calibrations in the North Carolina State University wind tunnel, but the results of these calibrations were not available when this paper was being written.] Both the standard S-type pitot tube probe and modified probe supplied by EPA displayed degradation of performance with increased swirl. However, while the modified S-Type probe displayed a swirl response curve similar to the estimations shown in Figures 1 and 3, based on previous work done in straight flow wind tunnels, the effect of swirl on the standard S-Type probe was considerably less than expected. Earlier work suggested an axial velocity bias of about 25% for yaw angles approaching 30 , while the swirl tunnel test results indicate a bias of only about 15%. S-Type Pitot Tube "Yaw Nulling" As part of the test series, a S-type pitot tube "yaw nulling" technique (or "null+90 " method) was evaluated for its potential for more accurately measuring axial velocity in the presence of swirl. Using the null+90 method involves finding the total velocity vector by first rotating the S-type probe to an angle (the "null angle") where the pressures measured at tubes A and B of the pitot are equal, i.e., the differential pressure across the two pitot heads equals zero. The total velocity vector is assumed to be moving perpendicular to the probe plan when it is in the null position, and rotating the probe 90 will point the probe in the direction of the flow. Multiplying the cosine of the angle of the probe with respect to the axial direction by the total velocity provides the axial velocity. It is important to realize, however, that this technique can only account for the yaw component of the flow and cannot compensate for pitch. During the tests, non-repeatability was observed when using the null+90 method. A separate series of tests was conducted to investigate this phenomenon. For the tests, the differential pressures across the two tubes of the S-Type pitot (PA-PB) were measured over a wide range of angles, with readings recorded in 5 increments. Three different probes and four swirl conditions were investigated. Figure 9 shows typical test results. In all cases, multiple null points were found when the probe was positioned close to the sampling port-side wall, but not elsewhere, not even near the far wall. The multiple nulls, although not completely understood, appear to be an interaction between the wall and probe itself. [This phenomenon has not been observed during EPRI field testing in utility stacks. Whether this effect is limited to small ducts is unclear.]
CONCLUSIONS The test results clearly demonstrate that swirl introduces bias in flow measurements taken using S-type pitot tubes. The degree of swirl-induced bias, however, appears to be significantly less than previously estimated. Earlier work, performed in straight-flow wind tunnels, suggested about a 10% greater bias (at 30 yaw) than seen in the swirl tunnel. With the exception was the EPA DAT probe, spherical and DAT probe measurements showed excellent agreement with the venturi. As expected, the spherical probe slightly outperformed the DAT probe. An incorrect calibration was suspected with the EPA DAT probe, but has not yet been confirmed. Little difference was observed between the manual manometer and automatic electronic pressure transducer readings, and potential problems (multiple null points) were encountered with S-type pitot "yaw nulling." Preliminary results of the EPRI field tests work, however, suggest that these findings may not transfer to a utility stack. In the field, a bias of 1 to 2% seems to be related to manual pressure readings. Multiple null points have not been found, even near the walls, with S-type pitot "yaw nulling" in large utility stacks.
Agora Environmental Consulting |
||||||||||||||||||||||||||||||||||||||||||||||||||||||||||||||||||||||||||||||||||||||||||||||||||||||||||||||||||||||||||||||||||||||||||||||||||||||||||||||||||||||||||||||||||||||||||||||||||||||||||||||||||||||||||||||||||||||||||||||||||||||||||||||||||||||||||||||||||||||||||||||||||||||||||||||||||||||||||||||||||||||||||||||||||||||||||||||||||||||||||||||||||||||||||||||||||||||||||
