


 |
|
The Electric
Power Research Institute Continuous Emissions
Monitoring
Heat Rate Discrepancy Project
What Has Been Learned and Future Activities
|
AUTHORS
|
Richard
D. McRanie
Stephen K. Norfleet
RMB Consulting & Research, Inc.
5104 Bur Oak Circle
Raleigh, NC 27612
|
Charles
E. Dene
Electric Power Research Institute
3412 Hillview Avenue
Palo Alto, CA 94303
|
Presented at the 1997
EPRI CEM Users Group Meeting
Denver, Colorado
May 14-16, 1997
ABSTRACT
Since installing continuous emissions monitoring systems
(CEMS) as required by the Acid Rain Rule (40 CFR Part
75), many utilities have noted that the CEMS are
recording consistently higher heat input and SO2
emissions than conventional methods (input/output and
output loss). The apparent CEMS bias is causing utilities
to report more heat input and SO2 and CO2 emissions than
are believed to be justified. Many believe that the major
problem is Method 2, the Environmental Protection Agency
(EPA) standard measurement method for stack volumetric
flow rate. It has been clearly shown by previous work in
this project that Method 2 will be biased high in the
presence of "swirling stack flow" and, since
all of the stack volumetric flow monitors are calibrated
to Method 2 measurements, a high bias in Method 2 will be
directly transferred to the flow monitors. In addition to
the potential high bias in stack flow measurement, any
high bias in SO2 or CO2 stack gas concentration
measurement will also bias the overall mass (lb/hr)
emission rate.
In order to better understand the problem, the Electric
Power Research Institute (EPRI) initiated a project to
identify the cause(s) for the high heat input and SO2/CO2
emissions measurements. This project has three basic
objectives: (1) to understand the potential error in
Method 2 under stack flow conditions by the review of
existing literature and data, (2) to demonstrate the
validity of the literature assessments by conducting flow
measurements in a specially designed "swirl
tunnel," and, (3) to verify the flow and heat input
errors, and identify the cause(s) in full scale field
tests. During the course of this project several
technical issues have been identified that dictate
further investigation.
This paper contains the summary results of the swirl
tunnel measurements and full scale field tests and also
describes future project plans to further investigate
additional issues that have been discovered during the
course of the project. The swirl tunnel tests were
performed in a precision flow facility with custom
fabricated swirl vanes for inducing different tangential
flow components, variable speed fan control for flow rate
adjustment and a venturi section for total flow
measurement. Summary results are presented from tests
designed to systematically assess the effect of non-axial
flow components on EPA Methods 1 and 2, the relative
suitability of alternative multidimensional pitot probes
and the relative accuracy of pressure reading
instrumentation. The full-scale field tests were
conducted under tightly controlled conditions so that the
error sources could be identified and quantified. Almost
every possible source of heat rate discrepancy was
simultaneously evaluated. Flue gas flow measurements were
made using different 2-D and 3-D pitots. Independent gas
concentration measurements were made. Unit heat rate was
determined using the conventional input/output method.
Multiple fuel sampling and analysis approaches were used.
The results of this simultaneous, multiple methodology
approach helped shed light on the sources of heat input
error.
INTRODUCTION
Virtually all electric utility power plants were required
to install CEMS as a result of the Acid Rain Program
mandated by the Clean Air Act of 1990. Monitors were
required for SO2, NOX, CO2 and stack volumetric flow
rate. In addition to measuring emissions, CEMS have been
used (using fuel F-factors, CO2 concentration and the
volumetric flow rate) to obtain boiler heat inputs and,
subsequently, unit heat rates. Since the installation of
the CEMS, many plants have found that the heat
input/rate, as determined by the CEMS, was higher (by
5-25%) than determined by conventional heat rate methods
(input/output or output loss). This discrepancy is
disconcerting since all of the methods should give
equivalent results. The heat input value from the CEMS
was immediately suspect since there is more than a
50-year history with the conventional methods and, in
many cases, the heat input from the CEMS was simply
thermodynamically improbable. The individual component of
the heat input measurement that was suspected to be the
major cause of the problem was the volumetric flow
measurement. The flow measurement instruments were new
and unproven while the CO2 instruments and F-factors had
been used for a number of years.
If, in fact, the flow measurement was in error, the
problem became more than disconcerting; it became a
matter of money. The flow measurement is a fundamental
component of the SO2 tonnage emission calculation and, if
high, results in excess SO2 allowances being used. A SO2
allowance permits a utility to emit one ton of SO2 and
the allowances can be bought and sold on the open market.
Therefore, using excess allowances can have a
multimillion dollar impact on a large utility. In
addition, many utility boilers have operating permits
that contain heat input and SO2 tonnage limits and, in
the past, compliance with these limits has been
demonstrated with fuel analysis. Some state agencies and
EPA regional offices have begun using the CEMS data to
evaluate compliance with the permit limits and have
started applying pressure on utilities that are showing
"excess" emissions and heat input.
The problem of high heat input was so pervasive
throughout the utility industry and the costs of excess
allowances were so great that the Electric Power Research
Institute (EPRI) initiated a project with RMB Consulting
& Research, Inc. to better understand the high heat
input measurement problem. The objectives of the project
are; (1) to identify the source(s) of the heat input
discrepancy, (2) to quantify the errors, and (3) to
suggest ways to reduce the error. In order to accomplish
these objectives a three-task project was developed.
Since flow measurement errors were suspected as the
primary problem, the first task was to conduct a
literature/technology survey on flow measurement methods
and potential errors. This work has been completed and a
report has been published (EPRI TR-106698, available to
EPRI members only). The results of Task 1 were also
reported in a paper presented at the May 1996 EPRI CEM
Users Group Meeting in Kansas City. Task 2 was to
construct a "swirl tunnel" and to test various
pitot configurations under controlled yaw swirl
conditions. This work has been completed and is
summarized in this paper. Task 3 was to confirm the
results of the swirl tunnel work and to define and
quantify error sources in a series of tightly controlled
field tests at power plants that were experiencing CEMS
heat input measurement errors. This paper also summarizes
the results of those field tests.
As we progressed through the project several new issues
were discovered that bear further study. Virtually all of
the CEMS CO2 analyzers appear to be reading slightly high
relative to reference test measurements. The readings are
not high enough to cause the CO2 analyzers to fail a RATA
but are contributing to the high bias in the heat input
measurements. Also, a considerable amount of pitch flow
(flow from the center of the stack toward the wall or
from the wall toward the center of the stack) was
observed at both field test sites. It is unclear how this
pitch flow may be impacting flow measurement
instrumentation.
SWIRL TUNNEL TESTS
One of the reasons for fabricating a tunnel where
controlled swirl could be induced was to demonstrate
whether error estimations based on straight-flow wind
tunnel testing were indeed comparable to the measurement
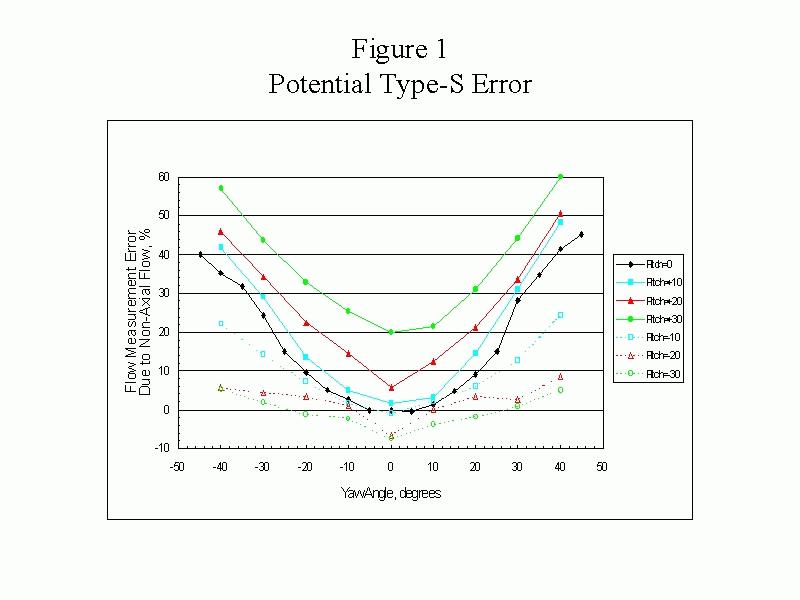
errors associated with true cyclonic flow. A number of
studies suggest that S-type pitot errors due to non-axial
flow can be significant, even with an average resultant
angle of less than 20o as allowed by Method 1. (Muzio,
L.J, et al.; Flue Gas Flow Rate Measurement Errors,
Interim Report TR-106698 2819-32; Electric Power Research
Institute, June 1996.) This error relates to a design
characteristic of the S-Type probe, its moderate
insensitivity to misalignment. This characteristic, while
minimizing bias associated with probe misalignment in the
tangential (yaw) or radial (pitch) flow directions,
contributes to bias when measuring flow with non-axial
components because the velocity head includes non-axial
components when only the axial component is desired. Figure 1 shows error estimations
for flows with both tangential and radial components as
simulated in a straight flow wind tunnel with combined
yaw and pitch misalignments of the pitot.
The "swirl tunnel" also allowed for more
complete testing of the relative suitability of
alternative two- and three-dimensional pitot probe
designs. If cyclonic flow is indeed a contributor to the
high bias with Method 2, one approach for more accurate
flow measurement is the use of directionally sensitive
probes rather than the S-type probe. If the pitch
component does not play a significant role, then,
perhaps, a two-dimensional probe or a "yaw
nulling" technique might suffice. As for 3-D probes,
the probe should ideally exhibit a high degree of angular
sensitivity with well-behaved responses to pitch and yaw
while the velocity measurement should be insensitive to
yaw and pitch.
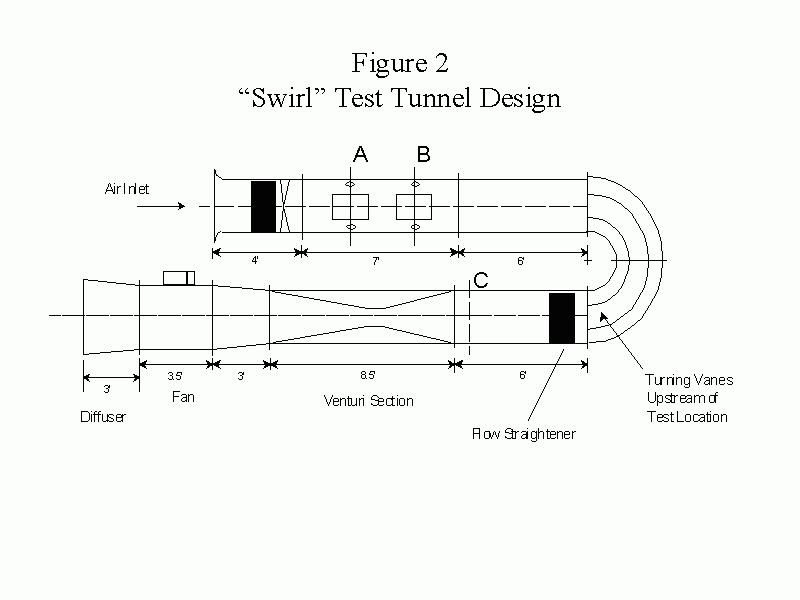
"Swirl Tunnel" Design
Figure 2 shows a layout of the
"swirl tunnel" along with its sampling ports.
The tunnel was constructed and located at Fossil Energy
Research Corporation's (FERCo) facility in Laguna Hills,
California. Due to space constraints, a two-level
construction, as shown in the figure, was used. The upper
section contained the swirl generating vanes and the test
stations while the lower section consisted of the venturi
and the fan.
Air entered the tunnel via a bell inlet after which it
passed through either a six-inch deep honeycomb flow
straightener (L/d=12, L/D=0.17 and d/D=0.014) or one of a
set of removable fixed vane sections used to generate the
non-axial swirl flow components. Leaving the swirl vanes,
the flow entered the test section, housing two test
stations with four ports each and plexiglas windows for
visualization. Upon leaving the test section, the flow
passed through a 180o bend incorporating turning vanes to
reduce the pressure drop and help straighten the flow,
i.e., keep the flow from "hugging" the bottom
of the duct as it exits the turn. Leaving the turn, the
flow passed through another honeycomb flow straightener,
the venturi section and then through the fan. The
venturi, which conformed to ASME specifications, had an
inlet diameter of 35.96 inches and a throat diameter of
23.45 inches. The fan was followed by a three-foot
diffuser.
A 50 hp variable speed axial vane fan capable of
maintaining five inches H2O of pressure powered the
tunnel. The unit was operated in an induced draft mode to
minimize fan effects on the flow. The tunnel duct had a
three-foot diameter with a flow of 38,000 scfm at a
velocity of 90 ft/sec.
Since only four swirl conditions were included in the
test plan (no swirl and three different levels of swirl),
removable fixed swirl vanes were opted over variable
swirl vanes to belay concerns over repeatability with
manually adjusted variable vanes. The vanes, fastened
together by a hub, were constructed with a constant angle
over the radius with 50% overlap so that no straight flow
would pass, (i.e., longer vanes were used to generate
smaller yaw angles). The vanes were designed to generated
yaw angles of approximately 10o, 20o and 30o. The vanes
produced very constant swirl angles across the duct with
very little pitch. The hub had little effect on the flow
beyond the very center of the tunnel.
Probe Comparison Testing
The swirl tunnel was used for comparison testing of the
following five probes, three supplied by EPRI and two
provided by EPA (other probes were also tested but are
not included with this paper):
•1.25" S-Type Probe
•1.25" DAT 3-D Probe
•1.25" Spherical 3-D Probe
•1.25" EPA DAT 3-D Probe
•An EPA modified S-Type
All EPRI supplied probes were new probes. The S-Type and
the DAT probes are standard, commercially available
probes that were manufactured by United Sensors. The
spherical 3-D probe was custom built for this project.
Prior to the testing, all of the EPRI supplied probes
were calibrated in the University of Alabama (Birmingham)
wind tunnel.
Four series of tests were performed. Tests were conducted
at three different velocities of approximately 50, 70 and
90 ft/s. The fourth test series was a duplicate of the 70
ft/s series to demonstrate repeatability. For each test,
the variable speed fan was adjusted until the approximate
desired velocity was indicated by the venturi. This
approximate velocity was maintained while traverses for
each of the various probes were tested in conjunction
with various swirl conditions. It was seen that the swirl
vanes designed to generate approximately 10o, 20o and 30o
of yaw actually yielded about 13o, 24o and 35o of yaw,
respectively. While slightly different from the
anticipated values, the actual swirl generated for a
particular vane was seen to be constant across the test
section.
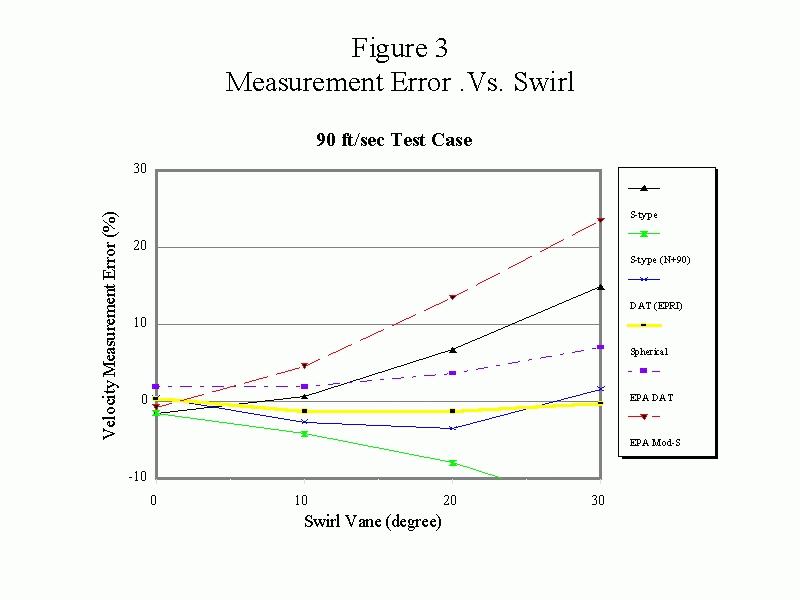
Figure 3 shows the measurement
error associated with the various probes at 90 ft/s,
where error is defined in terms of percent difference
with the venturi-based flow value. The results of the
EPRI DAT and Spherical 3-D probes were very similar and
demonstrated good repeatability. During the initial
tests, the response of the EPA DAT probe did not match
that of the EPRI DAT probe and performed much more poorly
than expected. An incorrect calibration was suspected,
and a misplaced 0° scribe line has been subsequently
confirmed. After correction, the EPA DAT data agree with
the EPRI DAT data.
Both the standard S-type pitot tube probe and modified
probe supplied by EPA displayed degradation of
performance with increased swirl. It is interesting to
note, however, that the effect of swirl on the standard
S-Type probe was considerably less than expected. As
shown by Figure 1, earlier
work suggested an axial velocity bias of about 25% for
yaw angles approaching 30o, while the swirl tunnel test
results indicate a bias of only about 15%.
As part of the test series, a S-type pitot tube "yaw
nulling" technique (or "null+90o" method)
was evaluated for its potential for more accurately
measuring axial velocity in the presence of swirl. Using
the null+90o method involves finding the total velocity
vector by first rotating the S-type probe to an angle
(the "null angle") where the pressures measured
at tubes A and B of the pitot are equal, i.e., the
differential pressure across the two pitot heads equals
zero. The total velocity vector is assumed to be moving
perpendicular to the probe plan when it is in the null
position, and rotating the probe 90o will point the probe
in the direction of the flow. Multiplying the cosine of
the angle of the probe with respect to the axial
direction by the total velocity provides the axial
velocity. It is important to realize, however, that this
technique can only account for the yaw component of the
flow and cannot compensate for pitch. Considerable pitch
flow was observed during both field tests and the effect
cannot be measured, or even detected, without a 3-D
pitot. In addition, performing a yaw null pitot traverse
in the field is just as difficult as performing a 3-D
traverse.
FIELD TESTS
Description of Units Tested
Field testing was performed at two large coal-fired
units. The first series of tests was performed at
Wisconsin Power & Light’s Columbia Unit 2.
Columbia Unit 2 is a conventional 560 MW (gross) unit
that burns Wyoming low-sulfur, sub-bituminous coal. The
CEMS is a typical dilution extractive system equipped
with an ultrasonic flow monitor. The CEMS and test ports
are located in the stack approximately 2.5 diameters up
from the entrance of two opposed entry ducts. The stack
diameter at the test location is 21 feet. The unit is
equipped with gravimetric coal feeders/scales using the
latest load cell-based technology. It also has an on-line
heat rate monitoring system.
The second series of tests was performed at Cooperative
Power’s Coal Creek Unit 2. Coal Creek Unit 2 is a
560 MW (gross) that burns lignite from an on-site mine
(mine-mouth). The unit is equipped with a lime-based SO2
scrubber. Lignite is supplied to the unit by six
gravimetric feeders/scales which were a mix of load
cell-based and an older technology. The CEMS is a typical
dilution extractive system equipped with an ultrasonic
flow monitor. The CEMS and test ports are located in the
stack approximately 7.7 diameters up from the single
entry duct. The stack diameter at the test location is
25.6 feet. This unit is also equipped with an on-line
heat rate monitoring system.
Columbia Unit 2 Field Test
Five tests were conducted at Columbia Unit 2. These tests
were based on preliminary findings on Unit 2 that
revealed flow with moderate yaw and pitch components.
Also, since the yaw components varied from port to port,
four additional test ports were added at a 45-degree
offset from the original ports. The five tests included
runs designed to compare the results of S-type and 3-D
pitot measurements and to evaluate the effect of test
port variation. During each test CEMS, coal flow and
reference method measurements were taken. Tests 1 and 2
were conducted with the unit operating at about 520 MW
(gross); Tests 3-5 were conducted with the unit operating
at about 550 MW (gross).
•Test 1: S-type/3-D comparison, No Test Port
Variation
•Test 2: S-type Only, No Test Port Variation
•Test 3: S-type/3-D comparison w/Test Port Variation
(Full Load)
•Test 4: S-type/3-D comparison, No Test Port
Variation (Full Load)
•Test 5: S-type/3-D comparison w/Test Port Variation
(Full Load)
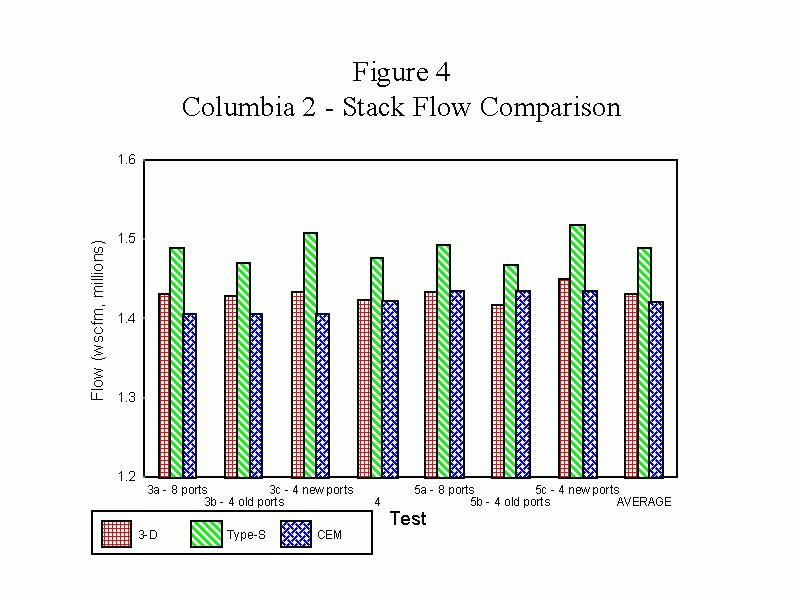
Figure 4 shows comparisons of
stack flow data for the tests performed at full load. The
S-type pitot measurements averaged 4.1% higher
(2.9%-5.2%) than the 3-D probe. This small difference
demonstrated the effect of the slight yaw swirl on the
S-type pitot.
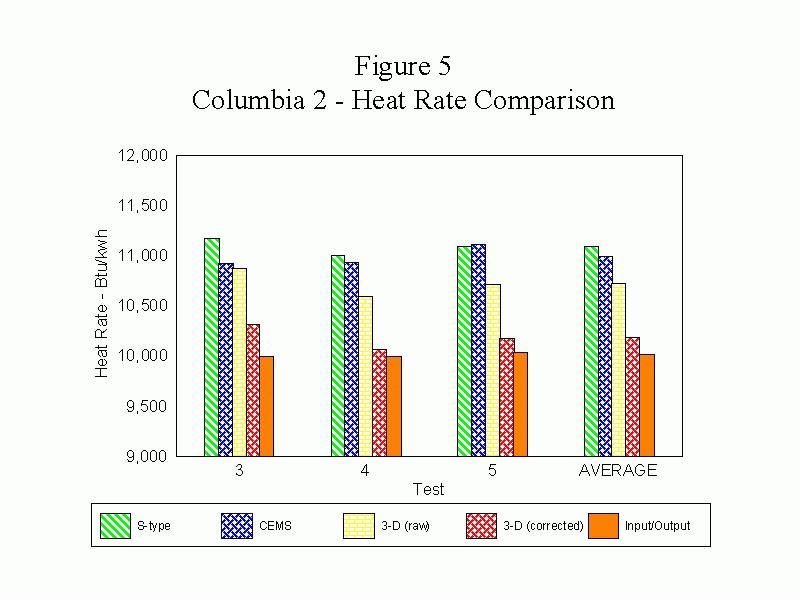
To illustrate the bias effects in terms of unit heat
rate, the results of the full load tests (Tests 3-5) are
shown in Figure 5. For
consistency, only flow traverse values taken from the
original test ports are included. Except as indicated by
the 3-D corrected bar, the data in Figure 5 are
uncorrected and based on manual Delta P readings. The
standard FC-factor of 1800 for subbituminous coal was
used and no corrections were made for wall effects. The
unit heat rate based on S-type pitot flow measurements
and reference method CO2 values was an average of 10.8%
higher and the heat rate based on CEMS data was an
average of 9.8% higher than the heat rate calculated
using the input/output method. The uncorrected heat rate
based on 3-D probe flow measurements and reference method
CO2 values was an average of 7.1% higher than the
input/output method. Figure 5 also shows that, with the
proper corrections, the 3-D-based heat rate agrees well
(within 1.9%) with the input/output method. (Discussions
of the corrections are included in a following subsection
-- See Heat Rate Bias Components)
Coal Creek Unit 2 Field Test
Seven tests were conducted at Coal Creek Unit 2. During
each test run, separate but simultaneous measurements
were taken by test teams from FERCo, RMB’s stack
test subcontractor and Climax, EPA’s stack test
subcontractor. (While many measurements were duplicated,
not all measurements for all tests were performed by both
test teams given the physical limitations of the test
site.) All tests were conducted with the unit operating
at full load, 560-565 MW (gross). During each test CEMS,
coal flow and reference method measurements were taken.
•Test 1: FERCo S-type and 3-D; Climax S-type and 3-D
•Test 2: FERCo 3-D; Climax S-type
•Test 3: FERCo S-type and 3-D; Climax S-type and 3-D
•Test 4: FERCo 3-D; Climax S-type and 3-D
•Test 5: FERCo S-type and 3-D; Climax S-type and 3-D
•Test 6: FERCo 3-D; Climax S-type and 3-D (w/near
wall measurements) •Test 7: FERCo 3-D; Climax S-type
and 3-D
For simplification, various aspects of the tests are
included in the preceding list. A "French"
probe was also tested as a potential alternative to the
S-type pitot and, while favorable, those results are not
included in this paper. Yaw nulling techniques were also
investigated but the results are not included
herein.
A comparison was made of simultaneous stack flow
measurements recorded by FERCo and Climax. The
measurements showed excellent agreement with an average
S-type flow value disagreement of less than 1.2% and an
average 3-D measurement disagreement of less than 0.8%.
(Since such good agreement was found, the average of any
duplicate measurements taken by FERCo and Climax was used
in any subsequent analysis contained in this paper.)
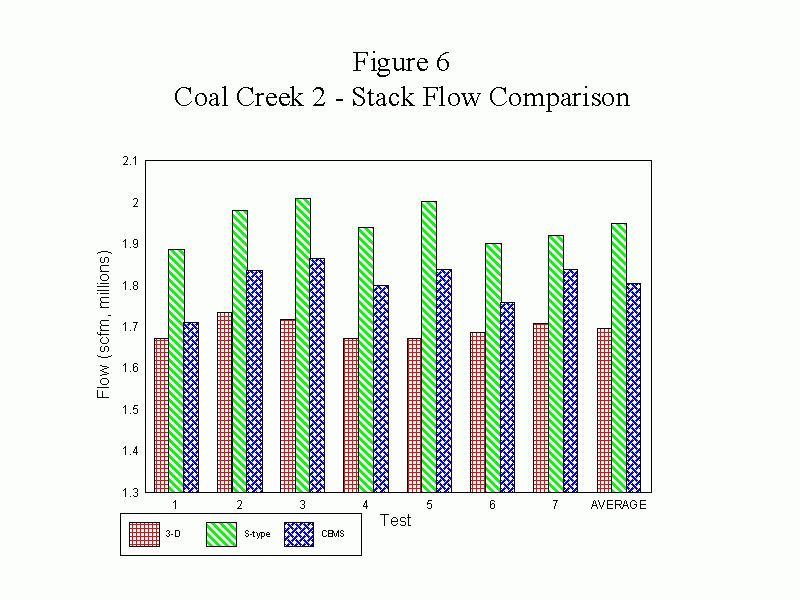
Figure 6 shows a comparison of
simultaneous stack flow measurements recorded during the
seven tests. The S-type pitot measurements were an
average of 15.0% higher (12.3%-19.9%) than the 3-D probe.
This large difference demonstrated the effect of the
significant amount of swirl (the average yaw angle was ~
21o ) on the S-type. The CEMS flowmeter reported values
an average of 6.6% higher (2.4%-9.9%) than the 3-D probe.
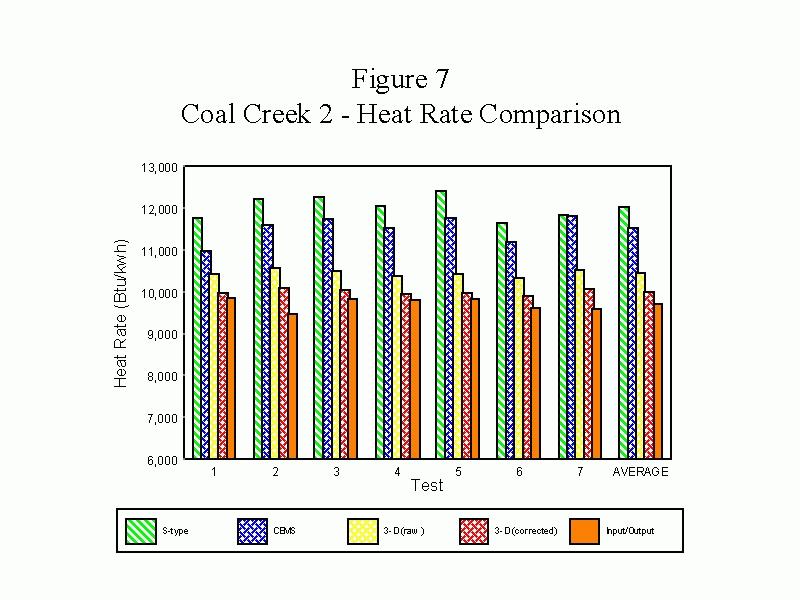
To illustrate the bias effects in terms of heat rate, the
results of the full load tests are shown in Figure 7. The data in Figure 7
are uncorrected and based on manual readings. Except as
indicated by the 3-D corrected bar, the standard
FC-factor of 1910 for lignite was used and no corrections
were made for wall effects.
The heat rates based on S-type pitot flow measurements
and reference method CO2 values were an average of 23.7%
higher than heat rate values calculated using the
input/output method and values based on CEMS data were an
average of 18.6% higher. The heat rates based on
uncorrected 3-D probe flow measurements and reference
method CO2 values were an average of 8.1% higher. Figure
7 also shows that, with proper corrections, the 3-D-based
heat rate agrees well (within 3.4%) with the input/output
method.
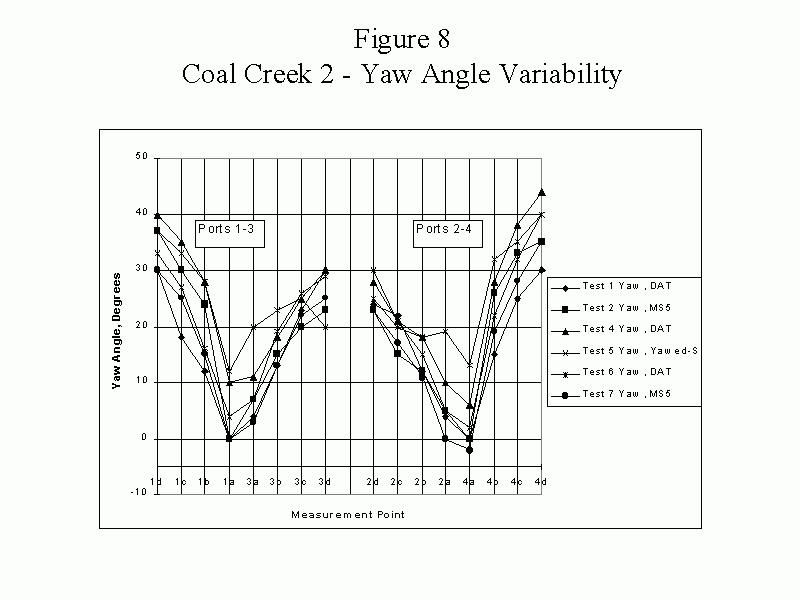
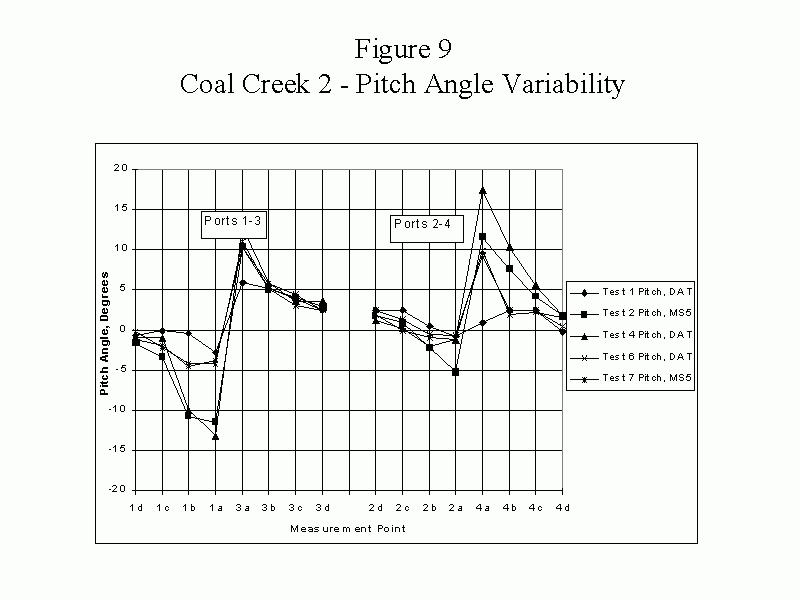
Curves depicting the yaw/pitch variation measured during
the Coal Creek tests are shown in Figure
8 and Figure 9. While
there was some variability in the angles measured from
test-to-test and fairly significant difference from
port-to-port, the pitch and yaw patterns remained
relatively consistent during the tests. This is not to
suggest that these "swirl" patterns are
consistent over long time periods.
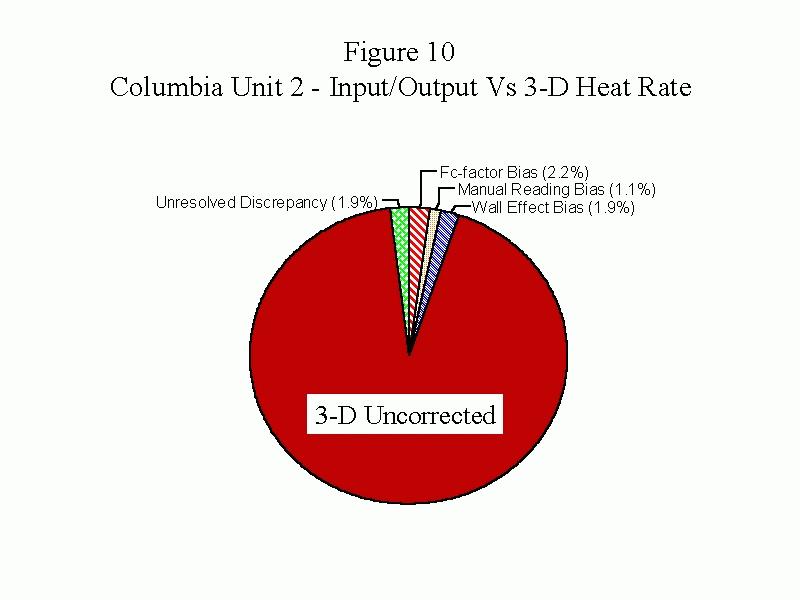
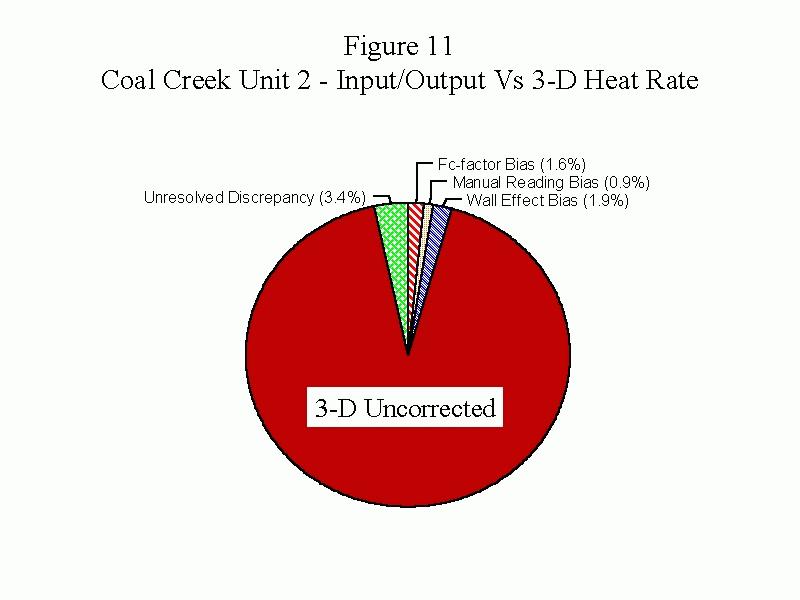
Heat Rate Bias Components
Figure 10 and Figure 11 illustrate the
discrepancies observed between heat rates based on 3-D
measurements and the input/output method at Columbia and
Coal Creek. As the figures show, once a few biases were
corrected, there was excellent agreement between the two
measurements. The corrected 3-D-based heat rate agreed
within 1.9% of the input/output-based heat rate at
Columbia and within 3.4% at Coal Creek. Corrected biases
to the 3-D-based heat rate values included:
•FC-factor. At Columbia, the FC-factor calculated
based on the average coal percent as-fired carbon and
average gross calorific value as determined from as-fired
samples collected during the tests was 1839 scf
CO2/mmBtu. Using the standard FC-factor of 1800 would
result in an overestimation of the heat rate by
approximately 2.2%. At Coal Creek, the FC-factor
determined from the as-fired coal analysis was 1942 scf
CO2/mmBtu. Using the standard FC-factor of 1910 for
lignite would result in an overestimation of the heat
rate by approximately 1.6%.
•Wall effects. The S-type and the 3-D flow values
were based on equal area traverses which do not take into
account the fact that the stack velocity goes to zero at
the stack wall. To account for this effect, near wall
measurements were taken at Coal Creek. Based on numerical
integration, not taking into account the wall effects
introduces a bias of 1.9%. Similar effects were also seen
in the "swirl" tunnel tests. (Although near
wall flow measurements were not taken at Columbia, it is
assumed that the wall effect at Columbia is approximately
equal to that seen at Coal Creek based on the similarity
of the stacks.)
•Manual pressure reading bias. During the field
tests, pitot Delta P readings were made both manually
using calibrated magnehelics and automatically using a
data logger equipped with precision pressure transducers.
Subsequent analysis revealed a consistent bias in the
manual readings when compared to the readings collected
automatically using the data logger. This bias appears to
be related to a tendency of individuals to overestimate
when doing "eyeball averaging" of fluctuating
readings. At Columbia, the manual readings resulted in
flow values 1.1% higher than those based on the automatic
readings. At Coal Creek, the manual readings resulted in
flow values 0.9% higher than those based on the automatic
readings.
With S-type pitot measurements, in addition to the bias
introduced by the FC-factor, wall effects and manual
pressure readings, bias is also introduced by non-axial
flow:
•Non-axial flow. The difference between the S-type
and the 3-D flow values is related to the non-axial
components of the flow that are erroneously included in
the velocity head of the S-type measurement. At Columbia
where only small non-axial flow components were found,
the S-type pitot yielded full-load flow values that were
4.1% higher than the 3-D measurements. Thus, the S-type
measurements, and subsequently the CEMS flowmeter data,
were biased 4.1% high due to non-axial flow conditions.
At Coal Creek, where significant non-axial flow
components were found, a 15.0% high bias due to non-axial
flow conditions was seen.
Since CEMS flowmeters are calibrated and certified using
S-type pitot reference method flow measurements, any bias
in the reference method would be passed on to the
certified flowmeter. These "calibration bias"
effects include wall effects, non-axial flow effects and
manual pressure reading bias. In addition to
"calibration bias" and FC-factor bias, any bias
in the CEMS CO2 measurement would also be transferred to
the CEMS-based heat rate value:
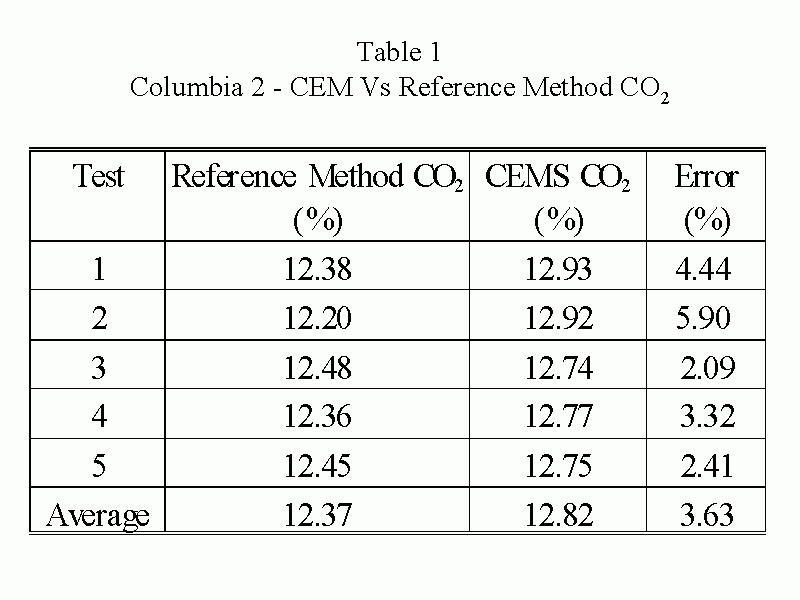
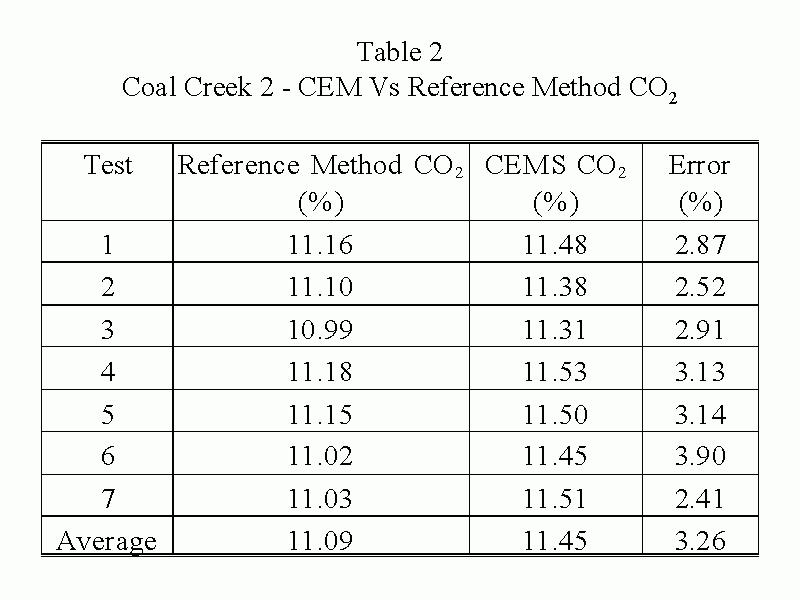
•CO2 Discrepancies. Table 1
and Table 2 show comparisons
of average CEMS and reference method CO2 values for
Columbia and Coal Creek, respectively. A consistent bias
is seen in the CEMS values when compared with the
reference method. At Columbia, the CEMS values were an
average of 4.5% higher than the reference method values.
At Coal Creek, the CEMS values were an average of 3.3%
higher than the reference method values. Any bias in the
CEMS CO2 measurements would result in a corresponding
bias in the CEMS-based heat rate. While some of the CEMS
CO2 error may be attributed to calibration drift, we
believe there may be a fundamental measurement difference
relative to the reference method. Small errors in CO2 are
not generally considered to be significant; however, at a
nominal 10,000 Btu/kWh heat rate an absolute 0.1% CO2
error is equivalent to about 100 Btu/kWh error in the
heat rate. Further study of CO2 error sources may be
desirable.
FUTURE ACTIVITIES
As discussed above, a number of "minor" errors
were noted during the field tests that are somewhat
inexplicable and need further evaluation. In addition,
there were fairly large time-dependent errors (drift)
observed in CEMs heat rate measurements that need
additional study.
A new EPRI project has been initiated to address these
issues. The objectives are:
A.To advise and support follow-on testing by EPA on
revisions to the reference methods for flow monitors.
B.Investigate the impact of pitch angle on flow
measurement methods and potential temporal changes.
C.Investigate apparent bias in CO2 measurements and
causes of non-linearity observed in operating CEMs.
Observe and Evaluate EPA Heat Rate Study
Since previous EPRI work has shown that Method 2 is
seriously flawed, EPA will soon begin a field study to
expand the EPRI study with respect to alternative flow
measurement probes. EPRI will follow and participate in
this EPA study. EPA will also be evaluating a revised 3-D
flow measurement method (Method 2F), drafted with
industry input, with consideration of promulgating the
method for use by electric utilities. EPRI will to
continue this interface with EPA to ensure that the
method(s) will be reasonably useable by utilities and
provide sufficient options for the wide range of industry
applications. This study will also evaluate the probe
calibration procedures used by the only vendor of 3-D
probes because there is some evidence that these
procedures are flawed.
Flow Tunnel Pitch Angle Study
There is mathematical evidence that stack flow pitch
angle changes over time may be causing the drift observed
in ultrasonic flow monitor measurements. (Pitch flow is
flow moving from the center of the stack toward the stack
wall or visa versa thus the interference with the
ultrasonic flow monitor.) In order to evaluate these
effects, the EPRI "swirl tunnel" will be
modified to create pitch flow. Following the
modification, a series of tests will be run to evaluate
the impact of pitch flow. (Previous studies had focused
on yaw flow because it has the most dramatic effect on
Method 2.)
The swirl tunnel will be equipped with a rotatable,
T-inlet configuration, designed to generate variable
amounts of pitch (and yaw) swirl. Following installation
of the new inlet, a series of characterization runs will
be made to define inlet setup conditions that generate
pitch and yaw swirl conditions that may be generally
defined as low, medium and high. After these settings are
defined, a series of parametric tests will be performed
using the DAT, MS5, S-type and French probes at one
tunnel velocity (70 ft/sec.). The tunnel tests will then
be evaluated for ultrasonic flow monitor impacts by
modifying a previously developed computational flow model
(CFD). A CFD model allows for the computation of pitch
and yaw angle across every point on the line-of-sight of
the ultrasonic flow monitor given some input conditions.
The expected flow monitor error can thus be calculated
across the total flow monitor path for each of the test
conditions from the swirl tunnel. A summary report will
then be prepared.
CO2 Analyzer Error and Linearity Study
From evaluation of a number of utility data sets and
during both of the field tests, an apparent constant
positive bias has been observed in CEM CO2 readings. This
error can have a significant impact on heat rates
determined from CEM systems. (A 0.1% absolute CO2 reading
error nominally equates to a 100 Btu/kWh error in heat
rate.) In addition, a number of electric utilities are
reporting difficulty in passing EPA required CO2 analyzer
linearity tests. This study is designed to address both
of these problems because they are likely related to
dilution probe or analyzer design effects.
Arrangements have been made with Scott Specialty Gases,
Thermo Environmental Instruments and EPM Corp. to host
and provide equipment at no cost for this study. Scott
will setup a test rig in their laboratory using
instruments and equipment provided by the other two
vendors. A series of tests will be developed to evaluate
the possible source of positive bias in the CO2 analyzer
readings. Sources of analyzer linearity problems will
also be evaluated.
It is well known that dilution probe sampling systems
(which represent the vast majority of utility CEMs) are
subject to a number of variations caused by stack
pressure, temperature and gas constituents. The pressure
and temperature variations are typically small under
normal operating conditions and should be random in
nature so that they are of little consequence over the
long term. In reality, EPA requires daily CEMs
calibrations so many of the short-term variations are
being observed and adjusted for, only to move in the
opposite direction the next day. Pressure and temperature
variations can theoretically be compensated and, in fact,
a considerable body of information exists on how to make
these compensations. Unfortunately, the corrections are
not well understood by utility personnel and, in many
cases, the equipment and algorithms needed to make the
corrections are either not present or are turned off in
the CEMS software. Consequently, a primary output of this
study will be a guidance document designed to clearly
explain the effects and how to implement appropriate
dilution probe corrections.
A test rig will be setup that will enable the
introduction of a wide variety of gas samples at various
temperatures and pressures to a complete CEMS analyzer
system (dilution probe, SO2, NOX, and CO2 analyzers). The
response of the analyzers will be evaluated based on
temperature, pressure and gas composition changes and
appropriate correction equations will be developed. All
of the empirically developed relationships will be
evaluated relative to theoretical effects. Finally, a
clear, concise guidance document will be prepared for use
by utility personnel.
CONCLUSIONS
Both swirl tunnel and field test results clearly
demonstrate that swirl introduces high bias in flow
measurements taken using S-type pitot tubes. The degree
of swirl-induced bias, however, appears to be less than
previously estimated from straight-flow tunnel
experiments. Earlier work, performed in straight-flow
wind tunnels, suggested about a 10% greater bias (at 30o
yaw) than seen in the swirl tunnel.
The spherical and DAT probe measurements showed excellent
agreement with the swirl tunnel venturi. A small
difference was observed between the manual manometer and
automatic electronic pressure transducer readings both at
the swirl tunnel and in the field.
Carefully controlled stack tests were conducted at two
sites to determine unit heat rate in comparison with
conventional input/output heat rate methodology. Closure
within 1.9% was achieved at one site and within 3.4% at
the other. Error sources impacting CEMS heat input/heat
rate measurements were identified and quantified.
It is clear that the EPA Reference Method 2 is biased
high in the presence of yaw swirl in the stack. The
amount of bias is related to the amount of yaw swirl--the
greater the swirl, the higher the bias. This results in a
high bias in stack volumetric flow monitors (and all
emissions calculated using the flow monitors) because all
of the monitors are presently "calibrated" to
Method 2. There is also a positive bias from the stack
wall effect that is approximately 2%.
At the two sites tested there was also a small bias
(average 1.9%) in the fuel Fc-factor and the present Acid
Rain rules allow for this correction. "Eyeball"
manual readings of Delta P also appear to have a slight
(~ 1%) positive bias relative to computerized
instrumental readings.
Both field test sites also showed a positive CO2 CEM bias
that was partially due to "within
specification" calibration drift; however, there was
some indication of an inherent positive bias. This
apparent problem will be investigated in more detail in
future work.
It is clear from these field tests that well controlled
stack tests, using precise test methods, can be made to
produce heat rate measurements that agree (within
experimental error) with conventional heat rate
methodology. Without equivalent EPA Reference Method
accuracy and precision, as well as appropriate real,
physical corrections, many utilities will continue to
report inaccurate, high-biased emissions under the Acid
Rain Program. As a follow on to the work discussed in
this paper, EPA is conducting further field tests to
determine whether to allow the use of 3-D pitots to
eliminate the yaw bias and to evaluate the wall effect
correction.
| Home | News | CAM | Training | FTP Library | Projects | Links | Contact
| Services | Feedback |
RMB Consulting &
Research, Inc.
Last Revised: May 22, 1998
|